- Amazon EC2 Instances Types
- AWS Optimizing Disk Performance
- Testing Filesystem Performance with Bonnie++
- bwm-ng (Bandwidth Monitor NG)
In this episode, I wanted to look at the performance characteristics between linear and striped logical volumes using LVM. We will examine what is happening behind the scenes along with some preliminary benchmarks using an AWS i2.8xlarge instance with 8x800GB SSD disks, 244GB of RAM, and 32 virtual cores.
Lets say for example that you have a requirement for an extremely fast storage subsystem on a single machine. You have a variety of hardware and software configuration options to choose from, some of which include, hardware RAID, software RAID using mdadm, LVM, or even mixing and matching these these. But for today, lets say you have narrows the selection down to LVM. So, do you choose to use LVM linear and striped logical volumes and which one has the best performance? As I mentioned a minute ago, we will be using a machine from Amazon’s Cloud Computing platform called AWS. The machine type is an i2.8xlarge storage optimized instance, with 32 virtual cpus, 244GB of RAM, 1x8GB internal OS disk, and 8x800GB SSD disks, all for about $6.80 an hour (less on the spot market).
I should note that when using LVM striped logical volumes, typically the more disks you have, the better performance you will see. I was originally going to use the AWS hs1.8xlarge instance type which has 24 x 2TB disks, but stopped after researching the idea, turns out that to see the best performance on this instance type you need to pre-warm the disks, this entails writing to every block on the device. For example, it could take 8 or more hours to pre-warm the disks on this instance type since it has 24 disks. Not wanting to doll out $4.60 per hours pre-warming the disks, I opted for the i2.8xlarge instance which uses SSD disks and does not need to be pre-warmed. I just wanted to highlight this in case you wanted to replicate my results on similar AWS hardware.
Lets briefly review what the system looks like before we get on with the demo. We are going to be using Ubuntu 14.04 as the operating system, on a machine with 244 GB ram. Here is what the mounts look like along with our 8GB OS disk which we talked about earlier. Finally, lets take a look at what disks this system has, here are our 8 SSD devices, /dev/xvd, b through i, and they are 800GB is size, just wanted to highlight this, since we will be referencing these devices several times throughout the episode today.
Before we jump into the demo we need to configure our environment first, so lets go ahead and install several prerequisites by running apt-get install lvm2, xfsprogs, used for formatting our LVM volumes as with the XFS filesystem, bwm-ng for disk I/O monitoring, and finally, bonnie++ for benchmarking the linear and striped LVM logical volumes.
apt-get install lvm2 xfsprogs bwm-ng bonnie++
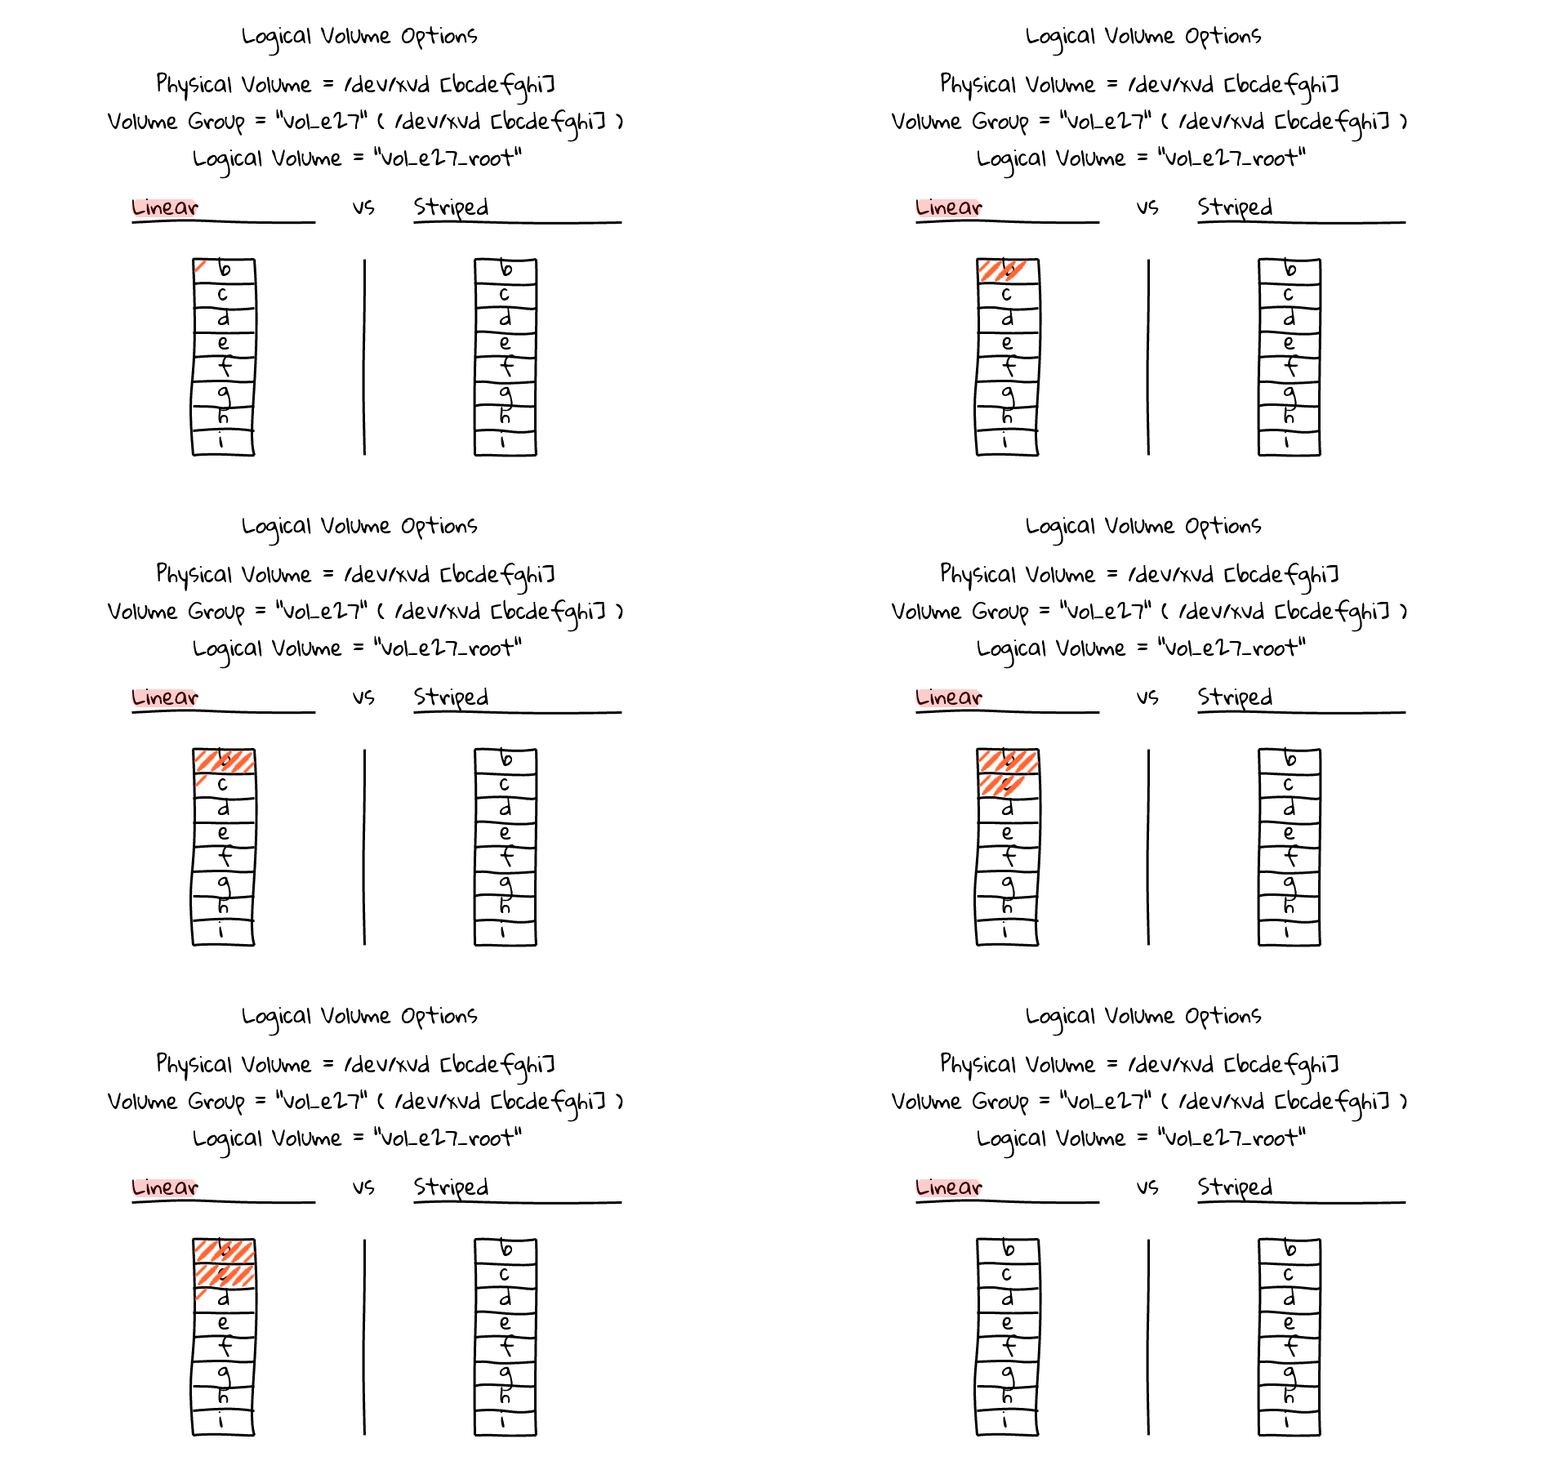
At a high level here is what our design is going to look like. We are going to create physical volumes out of the 8 SSD disks, then create a volume group called vol_e27 using those physical volumes, and finally create two logical volumes, one after the other, used for testing.
Now that we have the prerequisites installed, and I have given you an overview of the designs, lets run pvdisplay to verify we have no physical volumes configured. There are none configured, so lets go a head and create 8 physical volumes for our 8x800GB SSD disks by running pvcreate /dev/xvd, b through i.
pvdisplay
pvcreate /dev/xvd[bcdefghi]
  Physical volume "/dev/xvdb" successfully created
  Physical volume "/dev/xvdc" successfully created
  Physical volume "/dev/xvdd" successfully created
  Physical volume "/dev/xvde" successfully created
  Physical volume "/dev/xvdf" successfully created
  Physical volume "/dev/xvdg" successfully created
  Physical volume "/dev/xvdh" successfully created
  Physical volume "/dev/xvdi" successfully created
Okay, now that we have the physical volumes configured, lets go ahead and configure a volume group called vol_e27, for episode 27, and provide the physical volumes to use. Lets run vgcreate vol_e27 /dev/xvd, b through i. We can verify this worked by running vgdisplay. So, you can see we have a Volume Group called vol_e27 and it is roughly 6TB is size.
vgcreate vol_e27 /dev/xvd[bcdefghi]
  Volume group "vol_e27" successfully created
vgdisplay
  --- Volume group ---
  VG Name               vol_e27
  System ID
  Format                lvm2
  Metadata Areas        8
  Metadata Sequence No  1
  VG Access             read/write
  VG Status             resizable
  MAX LV                0
  Cur LV                0
  Open LV               0
  Max PV                0
  Cur PV                8
  Act PV                8
  VG Size               5.82 TiB
  PE Size               4.00 MiB
  Total PE              1526184
  Alloc PE / Size       0 / 0
  Free  PE / Size       1526184 / 5.82 TiB
  VG UUID               yn3lAL-HqxB-ZpiH-o4Zt-Z4EQ-8Wxx-M9kkaw
At this point we pretty much have things configure so we can dive into the demos. But before I do that, lets just recap, we have our 8 SSD disks configured as physical volumes, then we created a volume group called vol_e27 using those physical volumes, finally, for the demos today, we are going to create two logical volumes, one after the other, called vol_e27-root, one as a linear volume, and the other, a striped volume. By the way, the b through i, in those boxes under the linear and striped headings, are my attempt to display the physical volume SSD devices.
So, lets get started by creating a linear volume, by running “lvcreate –extents 100%FREE –name root vol_e27” which will create a logical volume, called root, using all the available space in the vol_e27 volume group.
lvcreate --extents 100%FREE --name root vol_e27
  Logical volume "root" created
Next, lets verify it worked by running lvdisplay. Personally, I like to use the /dev/mapper paths for accessing these types of devices, so lets verify that it exists, looks good. Lets also run fdisk -l /dev/mapper/vol_e27-root to verify that a new block device was created and it is roughly the size we expect it to be.
lvdisplay
  --- Logical volume ---
  LV Path                /dev/vol_e27/root
  LV Name                root
  VG Name                vol_e27
  LV UUID                5F3dSX-CbHC-j3m6-oY1c-bIN8-6mJC-RrZO3h
  LV Write Access        read/write
  LV Creation host, time ip-10-237-150-222, 2014-06-09 03:49:45 +0000
  LV Status              available
  # open                 0
  LV Size                5.82 TiB
  Current LE             1526184
  Segments               8
  Allocation             inherit
  Read ahead sectors     auto
  - currently set to     256
  Block device           252:0
fdisk -l /dev/mapper/vol_e27-root

Disk /dev/mapper/vol_e27-root: 6401.3 GB, 6401279655936 bytes
255 heads, 63 sectors/track, 778244 cylinders, total 12502499328 sectors
Units = sectors of 1 * 512 = 512 bytes
Sector size (logical/physical): 512 bytes / 512 bytes
I/O size (minimum/optimal): 512 bytes / 512 bytes
Disk identifier: 0x00000000

Disk /dev/mapper/vol_e27-root doesn't contain a valid partition table
Finally, to benchmark the device using bonnie++ we need to first create a filesystem on the device and then mount it. Today, I am going to use XFS since it is used in many large scale computing environments and allows you to quickly create a filesystem over a large chunk of disk, in our case, roughly 6TB. Lets run mkfs.xfs /dev/mapper/vol_e27-root, then create a mount point, by running mkdir /vol_e27, finally lets mount it, by running, mount /dev/mapper/vol_e27-root /vol_e27, and as always, verify our results. Okay, so at this point we have taken our 8x800GB SSD disks and turned them into a roughly 6TB linear logical volume mounted as /vol_e27.
mkfs.xfs /dev/mapper/vol_e27-root
meta-data=/dev/mapper/vol_e27-root isize=256    agcount=6, agsize=268435455 blks
         =                       sectsz=512   attr=2, projid32bit=0
data     =                       bsize=4096   blocks=1562812416, imaxpct=5
         =                       sunit=0      swidth=0 blks
naming   =version 2              bsize=4096   ascii-ci=0
log      =internal log           bsize=4096   blocks=521728, version=2
         =                       sectsz=512   sunit=0 blks, lazy-count=1
realtime =none                   extsz=4096   blocks=0, rtextents=0
mkdir /vol_e27
mount /dev/mapper/vol_e27-root /vol_e27/
df -h
Filesystem                Size  Used Avail Use% Mounted on
/dev/xvda1                7.8G  774M  6.6G  11% /
none                      4.0K     0  4.0K   0% /sys/fs/cgroup
udev                      121G   12K  121G   1% /dev
tmpfs                      25G  360K   25G   1% /run
none                      5.0M     0  5.0M   0% /run/lock
none                      121G     0  121G   0% /run/shm
none                      100M     0  100M   0% /run/user
/dev/mapper/vol_e27-root  5.9T   33M  5.9T   1% /vol_e27
At this point we are ready to do some benchmarking. I am going to open two terminal windows. In the first terminal window, we will run the bonnie benchmark software, then in the second we can monitor the SSD disk activity. The hope is that we can differentiate linear vs striped logical volumes both by the disk activity and benchmark results.
Okay, so lets get the bonnie benchmark software sorted out first. I found this pretty nice blog posting about how to run bonnie benchmarks along with a useful chain of commands to run. I have linked to this site in the episode notes below if you are interested in reading more. I am just going to paste the command as it is really long and point it at our /vol_e27 liner volume mount. Basically, we are running the bonnie benchmark software, along with taking into account the amount of RAM the machine has, making sure that we write well above the limit, in this case, we are going for twice the amount of RAM. The reason for this, is that we do not want to system to cache our benchmark in RAM, thus blowing the results.
bwm-ng -i disk -I xvdb,xvdc,xvdd,xvde,xvdf,xvdg,xvdh,xvdi

  bwm-ng v0.6 (probing every 0.500s), press 'h' for help
  input: disk IO type: rate
  |         iface                   Rx                   Tx                Total
  ==============================================================================
             xvdb:           0.00 KB/s       449924.16 KB/s       449924.16 KB/s
             xvdc:           0.00 KB/s            0.00 KB/s            0.00 KB/s
             xvdd:           0.00 KB/s            0.00 KB/s            0.00 KB/s
             xvde:           0.00 KB/s            0.00 KB/s            0.00 KB/s
             xvdf:           0.00 KB/s            0.00 KB/s            0.00 KB/s
             xvdg:           0.00 KB/s            0.00 KB/s            0.00 KB/s
             xvdh:           0.00 KB/s            0.00 KB/s            0.00 KB/s
             xvdi:           0.00 KB/s            0.00 KB/s            0.00 KB/s
  ------------------------------------------------------------------------------
            total:           0.00 KB/s       449924.16 KB/s       449924.16 KB/s
Before I start the benchmark, lets jump over to the second terminal, here we are going to watch the SSD disk activity to see how the reads and writes are spread across the disks. While doing research for this episode, I came across a very useful utility called bwm-ng, and we will use this tool to monitor reads and writes to each SSD device. So, here we have the bwm-ng software running, updating every half second, and watching our 8 SSD disks, /dev/xvd, b through i. I have pasted the exact bwm-ng command in the episode notes below.
bonnie++ -n 0 -u 0 -r `free -m | grep 'Mem:' | awk '{print $2}'` -s $(echo "scale=0;`free -m | grep 'Mem:' |
awk '{print $2}'`*2" | bc -l) -f -b -d /vol_e27/
Using uid:0, gid:0.
Writing intelligently...done
Rewriting...done
Reading intelligently...done
start 'em...done...done...done...done...done...
Version  1.97       ------Sequential Output------ --Sequential Input- --Random-
Concurrency   1     -Per Chr- --Block-- -Rewrite- -Per Chr- --Block-- --Seeks--
Machine        Size K/sec %CP K/sec %CP K/sec %CP K/sec %CP K/sec %CP  /sec %CP
ip-10-237-1 491996M           455205  38 239391  22           510353  25 322.0 103
Latency                       12847us   29639us             10133us    3411us

1.97,1.97,ip-10-237-150-222,1,1402297390,491996M,,,,455205,38,239391,22,,,510353,25,322.0,103,,,,,,,,,,,
,,,,,,,,12847us,29639us,,10133us,3411us,,,,,,
We are finally ready to run our benchmark now that we have the command ready to go and our monitoring pointed at the SSD devices. Lets start the benchmark in the first window, then jump over to the second window, where we have the monitoring software running. Looks like something is happening, but what is really interesting, is that we are only hitting the first SSD device, /dev/xvdb, and this behaviour happened throughout the entire benchmark. I should mention, that the entire benchmark took over an hour to run, so you are seeing a heavily edited summary.
So, what is actually happening here, why is one SSD only seeing the read/write traffic? Well, it is probably best described through a series of diagrams. When using liner logical volumes, you are essentially connecting these devices in series or daisy chaining them together. So, the reads and writes happen like this. Once one devices is full, it flows over to the next, etc. Kind of like a water fall effect. So, in this example, even though we have 8 SSD devices, our benchmark is only hitting the first device!

Okay, now that we have our results and know a little about how linear volumes work, lets move onto how striped volumes work. But first, lets clean up the linear volume, by unmounting the disk. Next we need to destroy the logical volume, we can do that by running lvremove /dev/vol_e27/root.
umount /vol_e27
lvdisplay
  --- Logical volume ---
  LV Path                /dev/vol_e27/root
  LV Name                root
  VG Name                vol_e27
  LV UUID                5F3dSX-CbHC-j3m6-oY1c-bIN8-6mJC-RrZO3h
  LV Write Access        read/write
  LV Creation host, time ip-10-237-150-222, 2014-06-09 03:49:45 +0000
  LV Status              available
  # open                 0
  LV Size                5.82 TiB
  Current LE             1526184
  Segments               8
  Allocation             inherit
  Read ahead sectors     auto
  - currently set to     256
  Block device           252:0
lvremove /dev/vol_e27/root
Do you really want to remove and DISCARD active logical volume root? [y/n]: y
  Logical volume "root" successfully removed
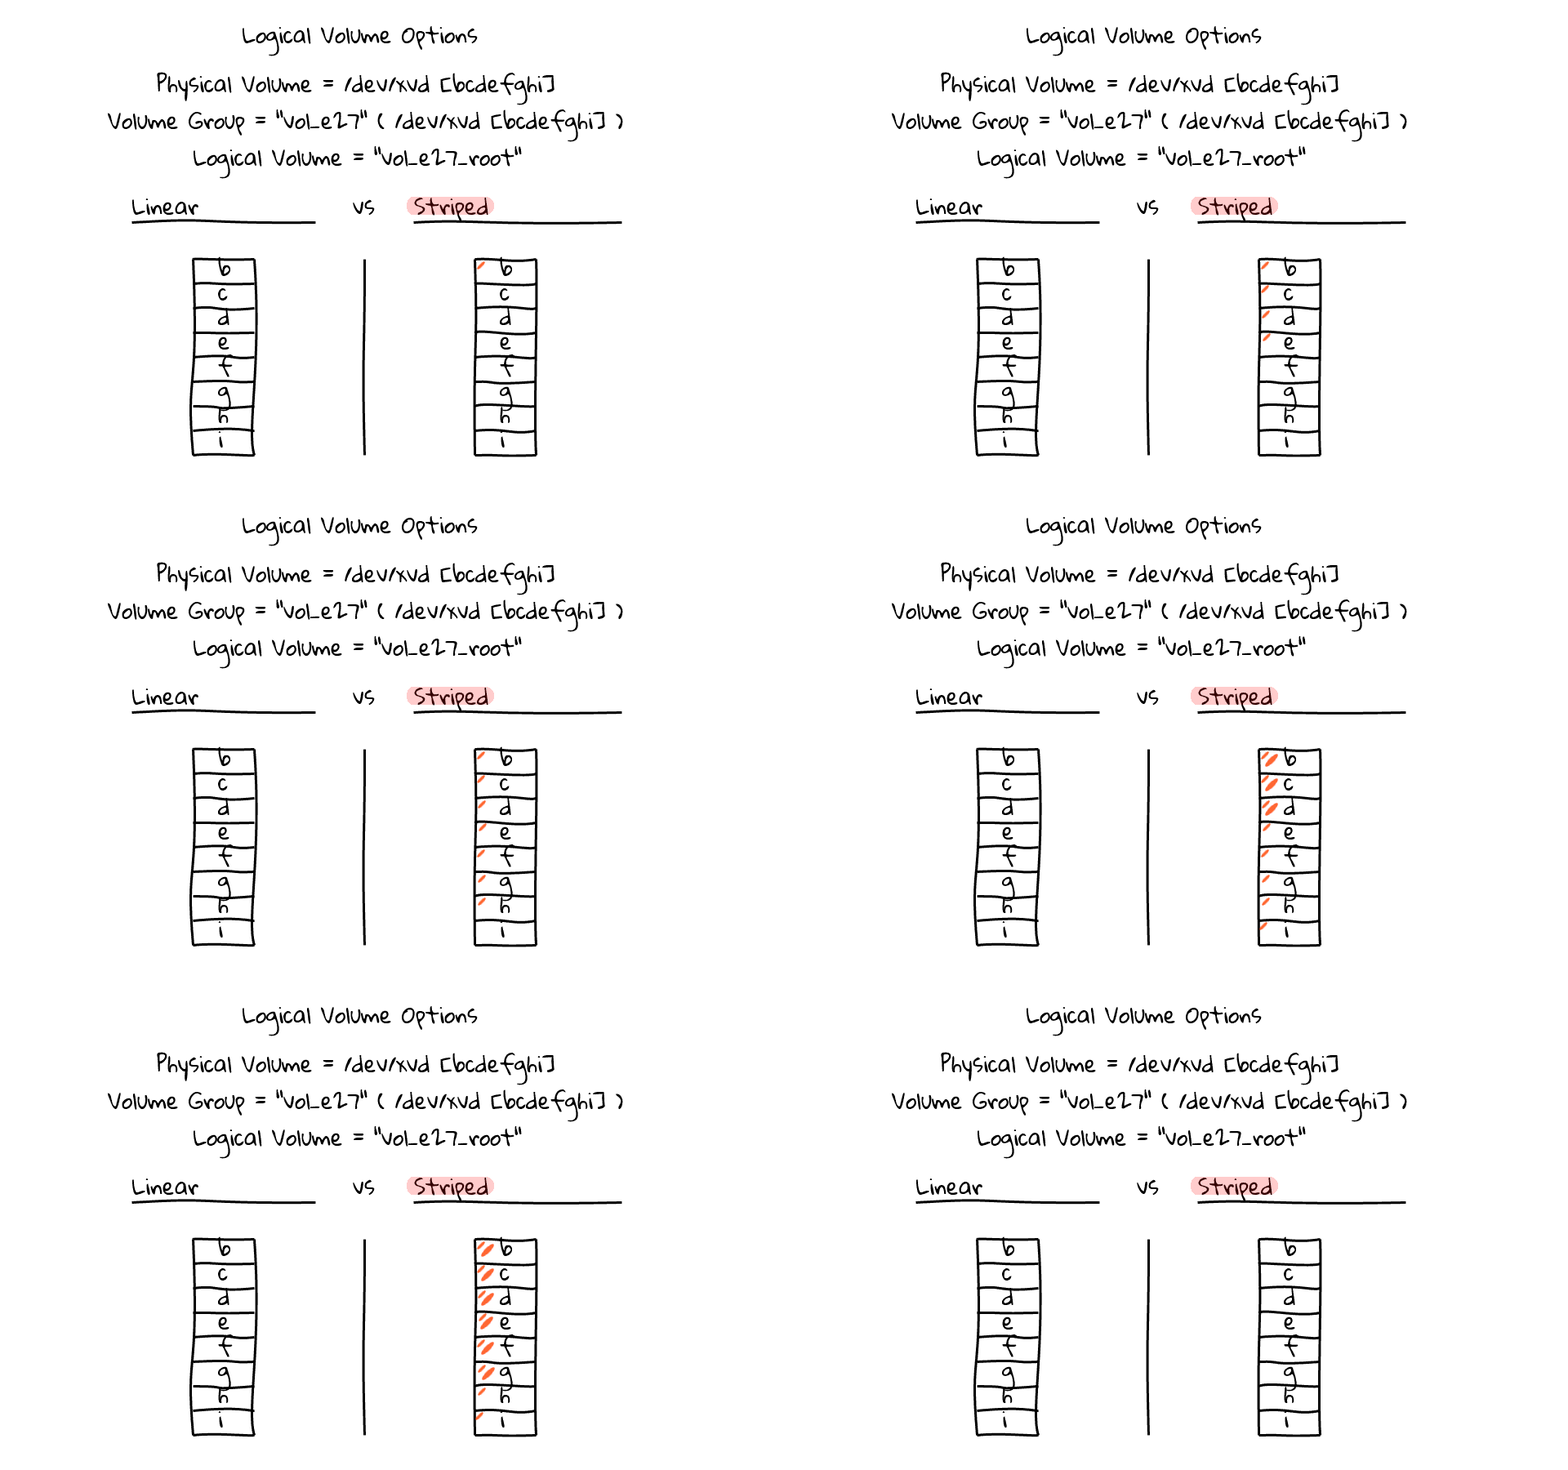
Okay, so lets just jump back to the diagrams for a minute. We still have our vol_e27 volume group, we just need to create a new striped logical volume, called vol_e27-root. Lets head to the console and do that by running, lvcreate –extents 100%FREE –stripes 8 –stripesize 256 –name root vol_e27. Easy enough right, and you will notice this command looks almost exactly the same as the earlier version, just with the added stripes and stripesize options. These rather simple options dramatically change the performance profile as we will see in a minute.
vgdisplay
  --- Volume group ---
  VG Name               vol_e27
  System ID
  Format                lvm2
  Metadata Areas        8
  Metadata Sequence No  3
  VG Access             read/write
  VG Status             resizable
  MAX LV                0
  Cur LV                0
  Open LV               0
  Max PV                0
  Cur PV                8
  Act PV                8
  VG Size               5.82 TiB
  PE Size               4.00 MiB
  Total PE              1526184
  Alloc PE / Size       0 / 0
  Free  PE / Size       1526184 / 5.82 TiB
  VG UUID               yn3lAL-HqxB-ZpiH-o4Zt-Z4EQ-8Wxx-M9kkaw
lvcreate --extents 100%FREE --stripes 8 --stripesize 256 --name root vol_e27
  Logical volume "root" created
I just wanted to mention that it is not always clear by looking at lvdisplay whether you are running in linear or striped mode. You can see that the default lvdisplay output does not tell you anything interesting in that regard. You can use lvs segments to give you a little information about the logical volume, but if you are looking for detailed information about the logical volume, try running lvdisplay -vm, as you can see there is a bunch of output, lets just scroll up here. So, we have our default output about the volume up top, then down here, we have detailed info about the stripe size and the devices which back it.
lvdisplay
  --- Logical volume ---
  LV Path                /dev/vol_e27/root
  LV Name                root
  VG Name                vol_e27
  LV UUID                cv5i1M-RDTn-00je-VLar-cvhm-7a5o-H06V24
  LV Write Access        read/write
  LV Creation host, time ip-10-237-150-222, 2014-06-09 06:41:48 +0000
  LV Status              available
  # open                 0
  LV Size                5.82 TiB
  Current LE             1526184
  Segments               1
  Allocation             inherit
  Read ahead sectors     auto
  - currently set to     8192
  Block device           252:0
lvs --segments
  LV   VG      Attr      #Str Type    SSize
  root vol_e27 -wi-a----    8 striped 5.82t
lvdisplay -vm
    Finding all logical volumes
  --- Logical volume ---
  LV Path                /dev/vol_e27/root
  LV Name                root
  VG Name                vol_e27
  LV UUID                cv5i1M-RDTn-00je-VLar-cvhm-7a5o-H06V24
  LV Write Access        read/write
  LV Creation host, time ip-10-237-150-222, 2014-06-09 06:41:48 +0000
  LV Status              available
  # open                 0
  LV Size                5.82 TiB
  Current LE             1526184
  Segments               1
  Allocation             inherit
  Read ahead sectors     auto
  - currently set to     8192
  Block device           252:0

  --- Segments ---
  Logical extent 0 to 1526183:
    Type        striped
    Stripes     8
    Stripe size     256.00 KiB
    Stripe 0:
      Physical volume   /dev/xvdb
      Physical extents  0 to 190772
    Stripe 1:
      Physical volume   /dev/xvdc
      Physical extents  0 to 190772
    Stripe 2:
      Physical volume   /dev/xvdd
      Physical extents  0 to 190772
    Stripe 3:
      Physical volume   /dev/xvde
      Physical extents  0 to 190772
    Stripe 4:
      Physical volume   /dev/xvdf
      Physical extents  0 to 190772
    Stripe 5:
      Physical volume   /dev/xvdg
      Physical extents  0 to 190772
    Stripe 6:
      Physical volume   /dev/xvdh
      Physical extents  0 to 190772
    Stripe 7:
      Physical volume   /dev/xvdi
      Physical extents  0 to 190772
Just as we did last time, lets go ahead and create a filesystem on this device by running, mkfs.xfs /dev/mapper/vol_e27-root. Then, lets mount it, by running mount /dev/mapper/vol_e27-root /vol_e27. Finally, lets verify it is mounted correctly.
mkfs.xfs /dev/mapper/vol_e27-root
meta-data=/dev/mapper/vol_e27-root isize=256    agcount=32, agsize=48837888 blks
         =                       sectsz=512   attr=2, projid32bit=0
data     =                       bsize=4096   blocks=1562812416, imaxpct=5
         =                       sunit=64     swidth=512 blks
naming   =version 2              bsize=4096   ascii-ci=0
log      =internal log           bsize=4096   blocks=521728, version=2
         =                       sectsz=512   sunit=64 blks, lazy-count=1
realtime =none                   extsz=4096   blocks=0, rtextents=0
mount /dev/mapper/vol_e27-root /vol_e27/
df -h
Filesystem                Size  Used Avail Use% Mounted on
/dev/xvda1                7.8G  894M  6.5G  12% /
none                      4.0K     0  4.0K   0% /sys/fs/cgroup
udev                      121G   12K  121G   1% /dev
tmpfs                      25G  372K   25G   1% /run
none                      5.0M     0  5.0M   0% /run/lock
none                      121G     0  121G   0% /run/shm
none                      100M     0  100M   0% /run/user
/dev/mapper/vol_e27-root  5.9T   34M  5.9T   1% /vol_e27
Just as we did last time, lets configure the bonnie benchmark to run in the first terminal window, and use the second for the disk monitoring software. Lets just quickly hop over to the second window and verify there is no disk activity before running the benchmark command. Looks good, so lets execute the benchmark and then watch the disk activity.
bonnie++ -n 0 -u 0 -r `free -m | grep 'Mem:' | awk '{print $2}'` -s $(echo "scale=0;`free -m | grep 'Mem:' |
awk '{print $2}'`*2" | bc -l) -f -b -d /vol_e27/
Using uid:0, gid:0.
Writing intelligently...done
Rewriting...done
Reading intelligently...done
start 'em...done...done...done...done...done...
Version  1.97       ------Sequential Output------ --Sequential Input- --Random-
Concurrency   1     -Per Chr- --Block-- -Rewrite- -Per Chr- --Block-- --Seeks--
Machine        Size K/sec %CP K/sec %CP K/sec %CP K/sec %CP K/sec %CP  /sec %CP
ip-10-237-1 491996M           1181305  99 835802  86           1982922  98 337.3 103
Latency                       37585us     131ms              3466us    6639us

1.97,1.97,ip-10-237-150-222,1,1402292207,491996M,,,,1181305,99,835802,86,,,1982922,98,337.3,103,,,,,,,,,,
,,,,,,,,,37585us,131ms,,3466us,6639us,,,,,,
At this point, you can see that all of our SSD disks are getting exercised. While doing research for this episode, it was explained that writes go to the disks in a round-robin fashion, and as you can see, this certainly seems to be the case, and this time around the benchmark completed much more quickly because we are actually using all of the disks.
bwm-ng -i disk -I xvdb,xvdc,xvdd,xvde,xvdf,xvdg,xvdh,xvdi

  bwm-ng v0.6 (probing every 0.500s), press 'h' for help
  input: disk IO type: rate
  |         iface                   Rx                   Tx                Total
  ==============================================================================
             xvdb:           0.00 KB/s       279249.51 KB/s       279249.51 KB/s
             xvdc:           0.00 KB/s       275417.17 KB/s       275417.17 KB/s
             xvdd:           0.00 KB/s       280782.44 KB/s       280782.44 KB/s
             xvde:           0.00 KB/s       280135.74 KB/s       280135.74 KB/s
             xvdf:           0.00 KB/s       279760.49 KB/s       279760.49 KB/s
             xvdg:           0.00 KB/s       279249.51 KB/s       279249.51 KB/s
             xvdh:           0.00 KB/s       278994.02 KB/s       278994.02 KB/s
             xvdi:           0.00 KB/s       278483.04 KB/s       278483.04 KB/s
  ------------------------------------------------------------------------------
            total:           0.00 KB/s      2232071.92 KB/s      2232071.92 KB/s
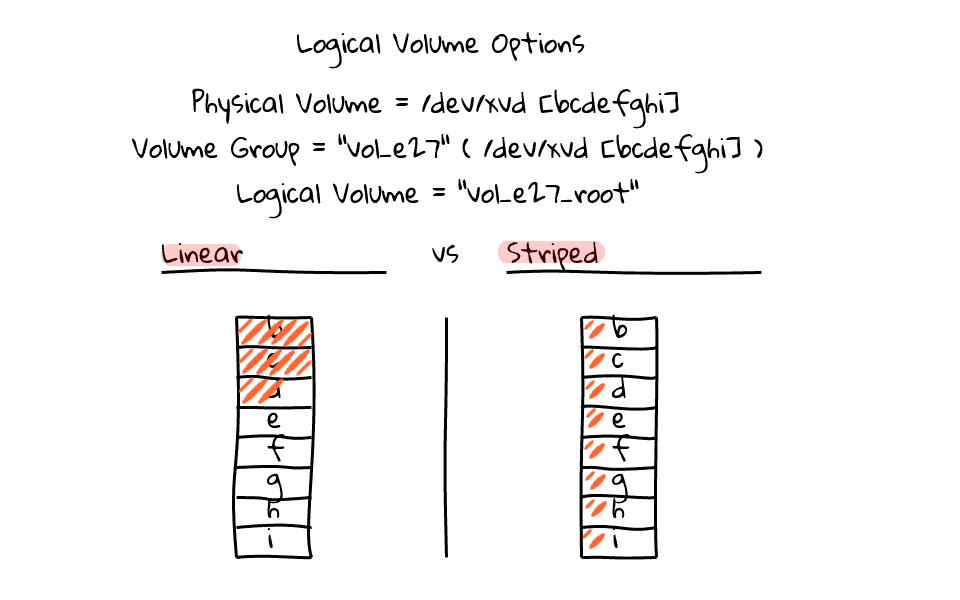
So, lets just recap with a couple diagrams and some closing notes. Linear volumes, like we saw in the earlier example, write to the disks in series, as one disk fills up, the next fills, and so on. This is in comparison to how striped logical volumes work. With striped logical volumes, writes head to the disk in a round-robin fashion, so you will actually see much better performance because you are using more disks, and not creating hot spots, or saturating one disk in the array.

This is probably a good place to leave this episode, as I think this one slide highlights the entire discussion. However, our results do raise some interesting questions, these are ones that you will likely run into too, if you venture down this path.

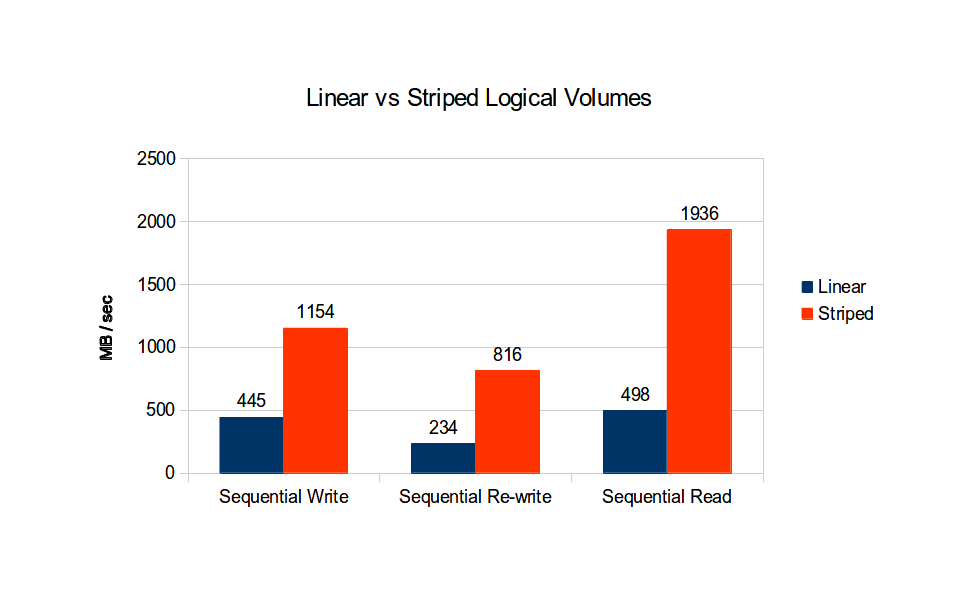
Here are the performance numbers between linear and striped logical volumes. As you can see, striped logical volumes absolutely kill linear volume types. What is interesting, is that I expected to see higher numbers, specifically for sequential reads for the striped volume type. AWS is a bit of a black box, in that if we had physical hardware, we could play around with various typologies to see if we can get better performance. Personally, I think we are saturating some type of link, but this is hard to diagnose without knowing the typology layout, or having access to the physical hardware.

The real goal of this episode was to teach the difference between linear and striped logical volumes and I think we have done that so far. But, if I was to implement this for a project I was working on, there are likely other bits I would want to test and profile. For example, try hardware typology designs to make sure you have IO channel separation and are not saturating a link somewhere. Try other filesystems or maybe try and align LVM stripe and filesystem block sizes. What about tuning for your specific workload?
There are also some issues with the way I did today tests. The disk activity monitoring might throw off our benchmarks, also maybe XFS was not a good filesystem choice. Not to mention, that if this was for a real project, I would have run multiple bonnie tests and averaged the results, but since this is just an illustration, I did not want to spend too much money on running the AWS instance for long periods of time.
Personally, this episode highlights what I love about Amazons Cloud Computing platform. Typically, as a sysadmin you will often be asked to spec something out for a particular project without having hardware. You are essentially guessing, hoping, and then praying that the hardware you spent tens of thousands of dollars on will meet your needs. But with AWS, you can fire up a beefy instance, test your ideas, and then come up with a working plan, typically within hours. As was demonstrated today, we used hardware which typically costs many thousands of dollars for several hours to test some ideas, which ultimately allowed us to get a firm idea of what we can expect on this hardware.